~/notes / monitoring-stack
Monitoring a Proxmox homelab with Prometheus and Grafana
One container runs Prometheus and Grafana, pulls metrics from the Proxmox host and every guest, and sends alerts to Discord with a short runbook in each one.
$ cat goal
- See how the Proxmox host and every guest are doing without logging in to check.
- Get a message when something breaks or is about to, instead of finding out when a service stops loading.
$ cat design
Everything runs in one container. Prometheus pulls metrics every 15 seconds from three exporters:
- node_exporter on the host for CPU, memory, disks, temperatures and network.
- node_exporter in the container so the monitoring box watches itself.
- pve-exporter for per-guest stats from the Proxmox API, using a read-only token with the
PVEAuditorrole.
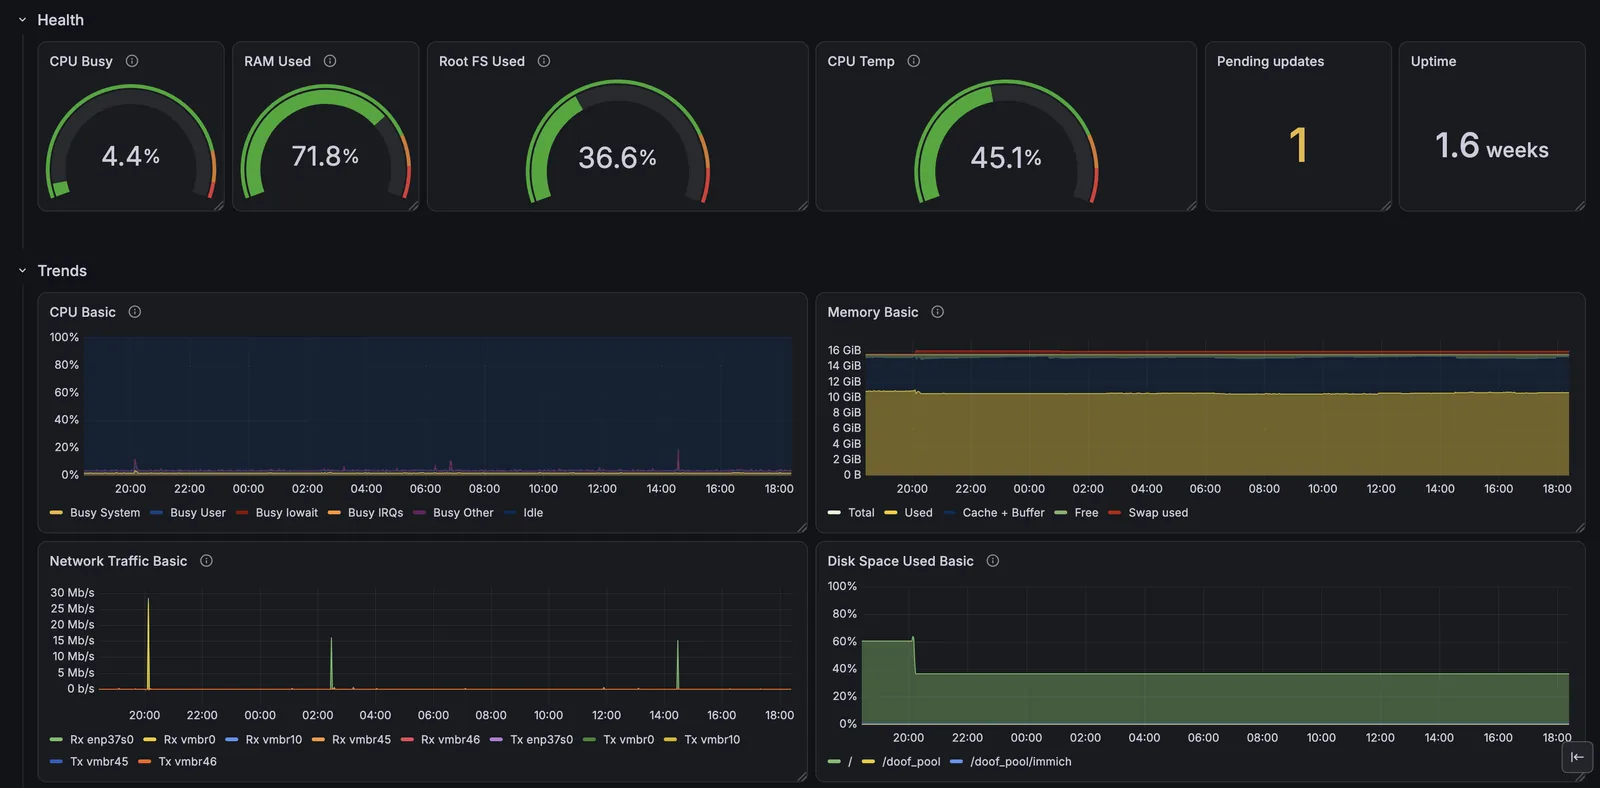
Grafana sits on top with one custom dashboard, reached through the reverse proxy over HTTPS. Alerts go to a Discord channel.
$ cat decisions
- Pull, not push. Prometheus asks each target for metrics. If a target stops answering, that's an alert on its own.
- Read-only everything. The Proxmox token can look but not change anything. The host exporter is firewalled so only the monitoring container can reach it.
- Alerts that say what to do. Each alert's description is a short runbook: what it means and the first thing to check.
- Alert on what actually hurts. Target down, storage or root filesystem over 85%, CPU temperature over 85°C, RAM over 90%, and any guest set to start on boot that isn't running.
$ cat gotchas
- An exporter died after I hardened it. I'd typed the listen-address flag wrong.
systemctl statussaid it failed.journalctlsaid why. - An alert fired for healthy targets. I'd written "above 0" where I meant "below 1". Now I preview every rule against real data before saving it.
- Grafana looked down on first start. It was running database migrations on a slow HDD. It just needed a few minutes.
$ cat verify
I stopped an exporter on purpose and watched the alert go Pending, then Firing, then land in Discord, then Resolved when I started it again.
promtool check config prometheus.yml
ss -tlnp | grep exporter          # listening where expected
$ cat lessons
- Test the alert, not just the rule. A rule that looks right can still fire all the time or never.
- Monitoring pays off fast. In the first week it showed me disk I/O spikes on the HDD and how much memory I'd promised my guests compared to what the host has.